
Q4 Economic Summary
US Stocks turned around in Q4 after falling for the first three quarters of 2022. The Nasdaq Composite continued in the red but was near flat for the quarter. The Dow Jones Industrial Average rebounded the most, posting a quarterly return of 16.01%. Global markets had similar returns, with the MSCI EAFE Total Return index returning 17.4% in Q4.

Ten of the eleven S&P Sectors had positive returns in Q4 of 2022. The Energy and Industrial sectors led the way with 22.7% and 19.12% returns, respectively. Consumer Discretionary was the only sector in the red, posting a -9.08% return for the quarter.

This table shows the performance of asset classes over different time frames.
World ex USA was the best performer in Q4, returning 16.3%. Domestically, US Value outperformed with a return of 12.4%, finishing the year behind the best—and only positive—performer of 2022: Commodities.

This visual shows historical quarterly asset class performance for the last 15 quarters.
All asset classes had positive returns in Q4. World ex USA led the way with a 16.3% return. US Treasuries fell back to the bottom of the pack, returning a mere 0.7%.

This slide points out various risk vs. return strategies, including stock to bond allocations of 80/20, 50/50, 20/80, and 100/0 (S&P 500). All four strategies had positive returns in Q4 2022 but ended negative on the year. The 20/80 allocation remains the relative outperformer over the previous year, down -11.61%.
This visual demonstrates the value that diversification can provide investors during turbulent periods—for both the stock and bond market.


The fourth quarter of 2022 brought more action in the yield curve. Treasury Rates continue to rise across the board with the exception of the 5-Year, and by so much in the short-end that the yield curve remains flattened past the point of inversion.
The 1-Year Treasury Rate ended Q4 at 4.73%, greater than both the 10-Year Rate’s 3.88% yield and the 30-Year’s 3.97%. The 10-2 Spread was inverted at the end of the quarter, with a differential of -0.53%.

This table is a heatmap of various economic data points which are considered leading indicators and shows their trends over time. The first four columns show a quarter-by-quarter change, whereas the following 12 columns show annual changes in the data. The 10-2 Year Treasury Yield has continued to drop, reaching levels that it hasn’t fallen to in 40+ years. The Philly Fed Manufacturing Activity Index and the NY Fed Current Business Activity Index both ended the year below zero, which was last seen during the 2020 Coronavirus pandemic. The S&P 500 logged its only positive quarter in Q4.

This image shows the trade activity between the USA and other key partners through September 30th, 2022. The chart on the left shows that US Imports have declined off their high, now below $1.0T per quarter. US Exports increased ever so slightly. The chart on the right shows the divergence of trade imports versus exports bouncing off its lowest US Trade Balance ever recorded in Q1 2022. The table below shows how imports have increased YoY in all regions. At the end of Q3 2022, Services Imports increased the most YoY in China at 33%. Goods Exports climbed the highest in the EU YoY, at 32%.

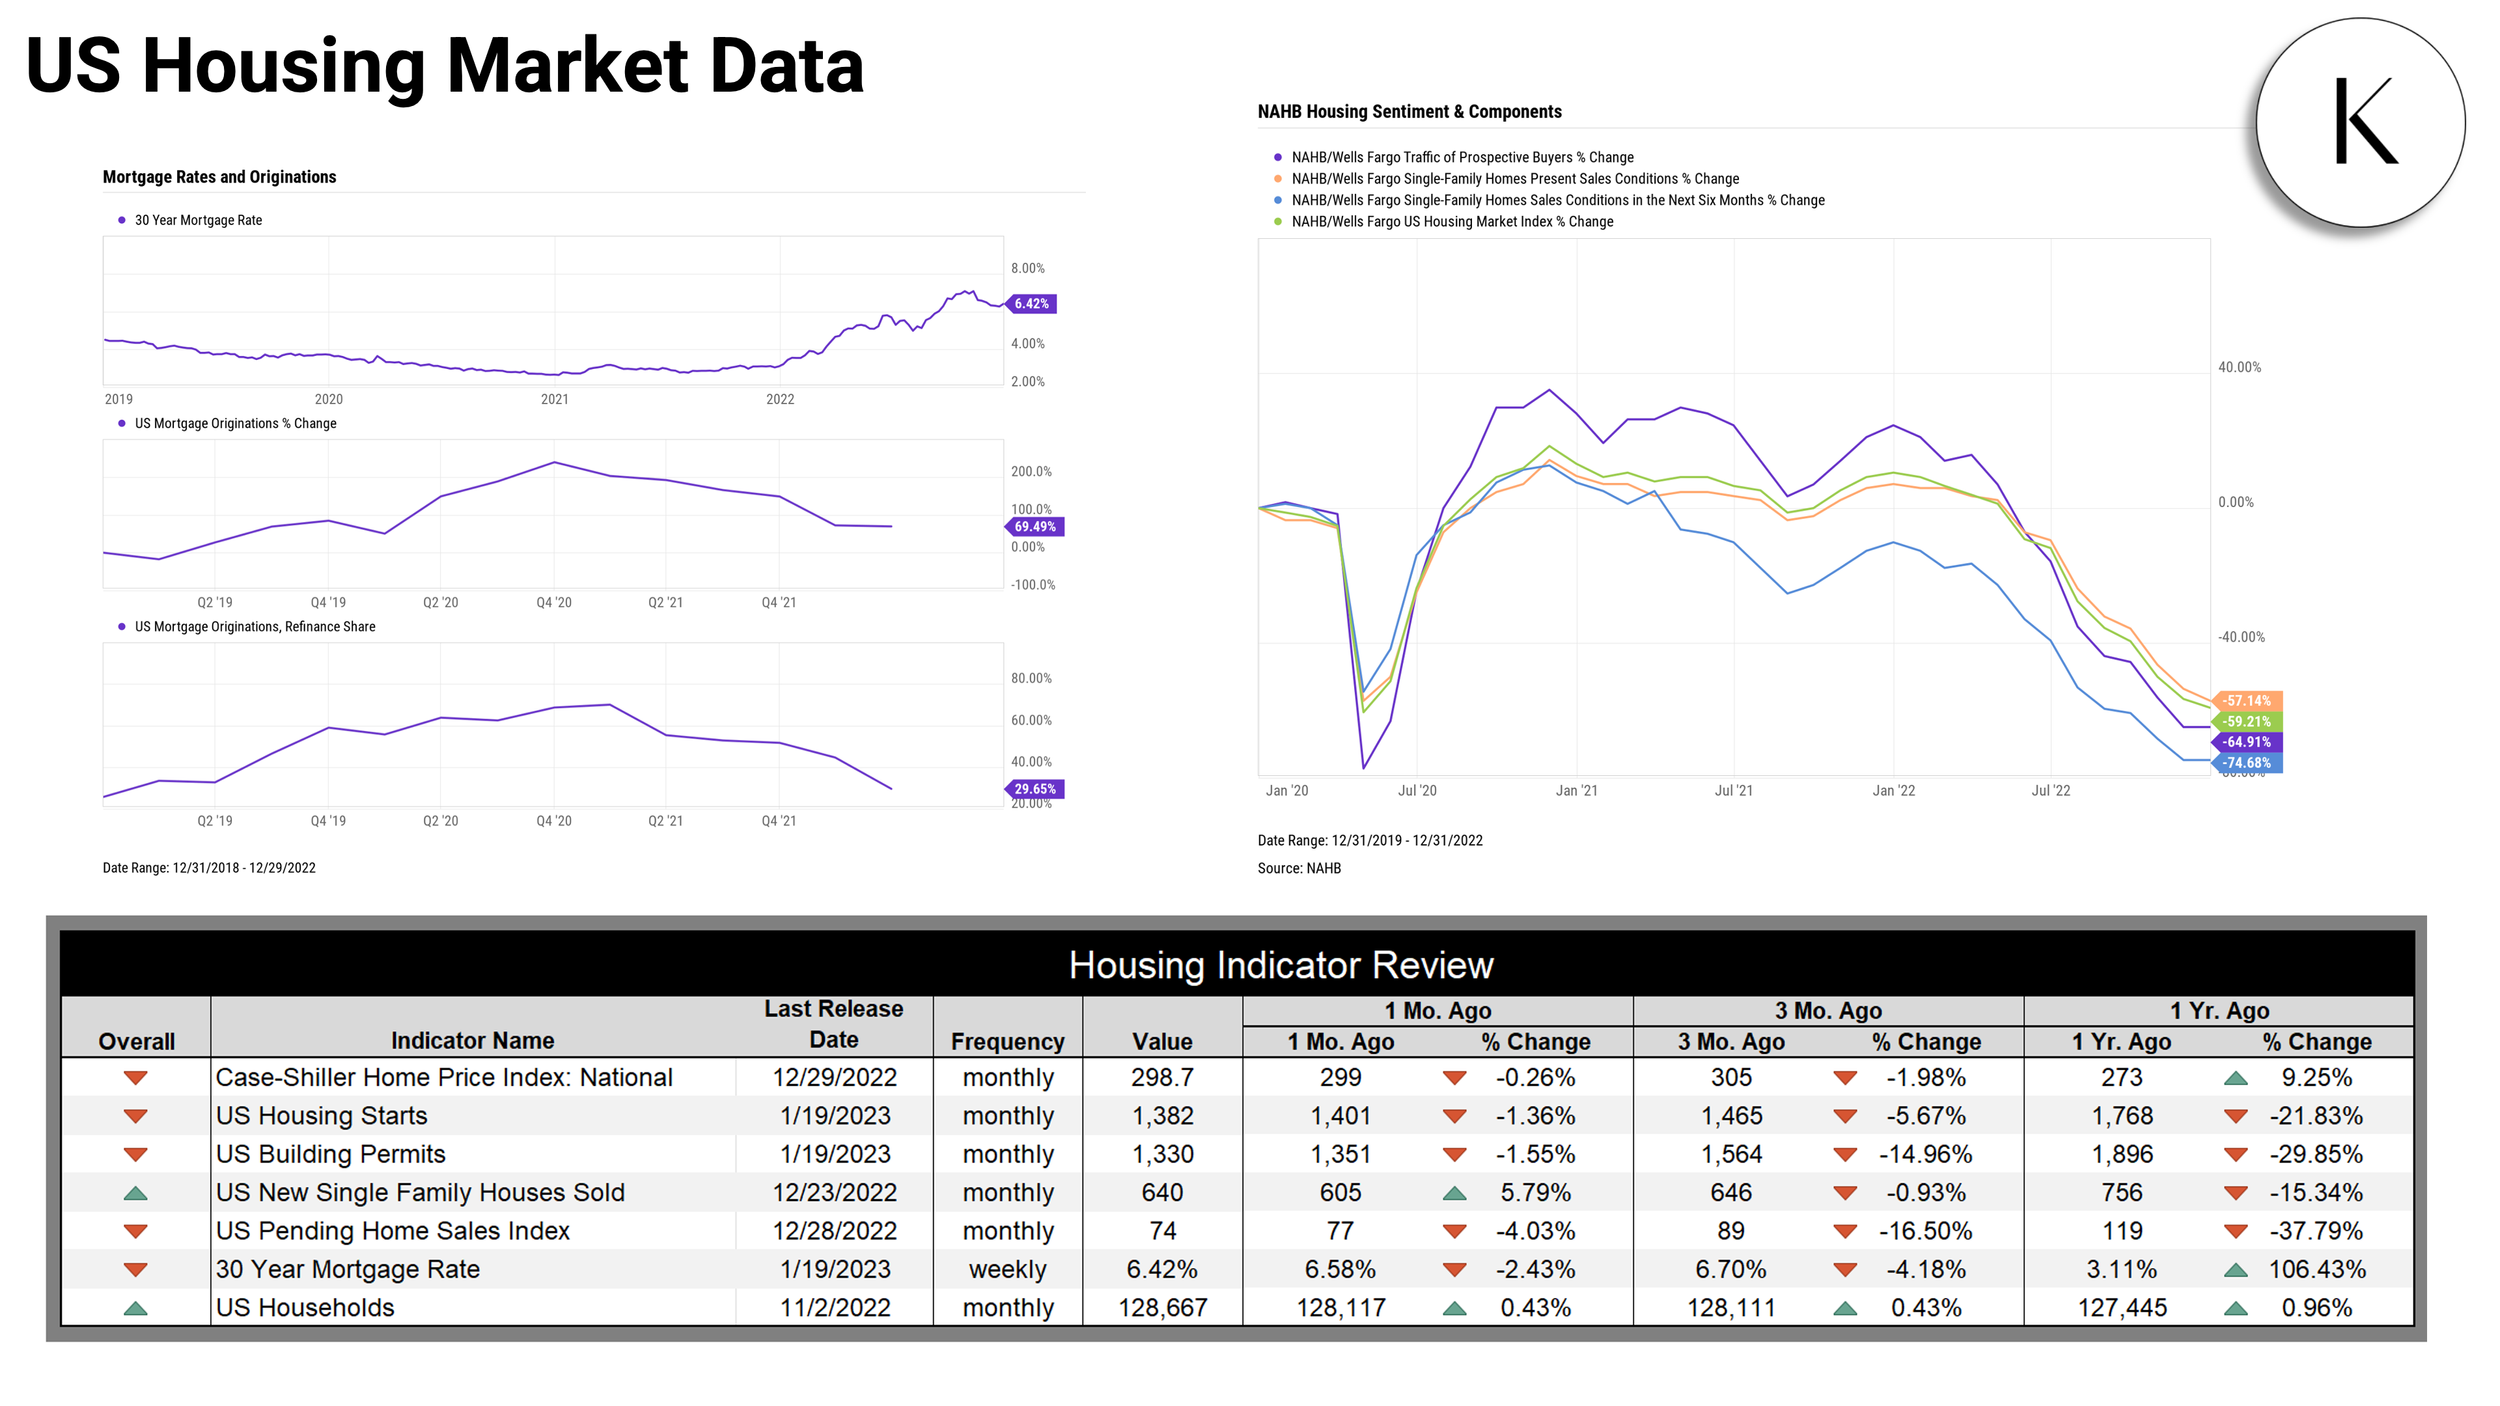
2021 brought with it the lowest 30 Year mortgage rate in decades. Since then, mortgage rates have shot higher—the 30-Year rate ended Q4 at 6.42%, causing mortgage originations to decline. Both the current and near-term outlooks for home sales continued to fall in Q4, according to data from the National Association of Home Builders (NAHB) and Wells Fargo.
The US Dollar to Euro, to Pound Sterling, to Chinese Yuan and to Japanese Yen exchange rates all fell from their 52-week highs in Q4 2022. All four rates are back down closer to their one-year averages.


The S&P 500 CAPE Ratio hit a 20-year high towards the end of 2021. Since then, a sharp decline has seen it regress towards its average over that time period, but at 28.39 is still two points above its 20-year average.

73% of the S&P 500 ended the year in the red for 2022. The chart above displays the amount of market cap lost by those losing companies in each sector. No Energy Sector stocks lost market cap in 2022, all ended the year positive.

The 60/40 Portfolio experienced its second worst calendar year returns since 1997, ending at -15.91%.

A strong majority of S&P 500 companies (~83%) had a positive Q4 return. However, that wasn’t enough to pull most constituents out of the hole on the year. Of those Q4 winners, only one third had a positive 2022. Tesla ($TSLA) had the worst Q4 performance, falling more than 50% in the quarter alone. Occidental Petroleum Corp ($OXY) performed best in 2022, rising 119%.

2022 saw some big names cool off from previous rallies. Megacap stocks lost tremendous amounts of market cap—Apple (AAPL), Microsoft (MSFT), Alphabet (GOOG, GOOGL) and Amazon (AMZN) shrank by a combined $3.177T in 2022.

Value investors, while still down for the year, stomached much lighter losses than their Growth equivalents in a year of high inflation.

Cryptocurrencies continued to fall throughout 2022, putting major coins 60-80% off their highs.


Hope you enjoyed the Q4 2022 Economic and Market Summary!
Thank you for reading.