
The Wall Street Report January 2023
January 2023 was the best start to a year since 1987 in the Markets, and top 5 since 1929.
January 2023 was the best start to a year since 1987 in the Markets, and top 5 since 1929. Read this month's issue of the Wall Street Report to obtain a summary on the stock market performance in January, including Economic Data and Fixed Income Overview.
How did the Markets perform in January 2023? What did investors and traders experience during the first month of the New Year? If you were out of the Markets at this time, chances are you missed out on strong bullish momentum across most asset classes. Let's dive in.
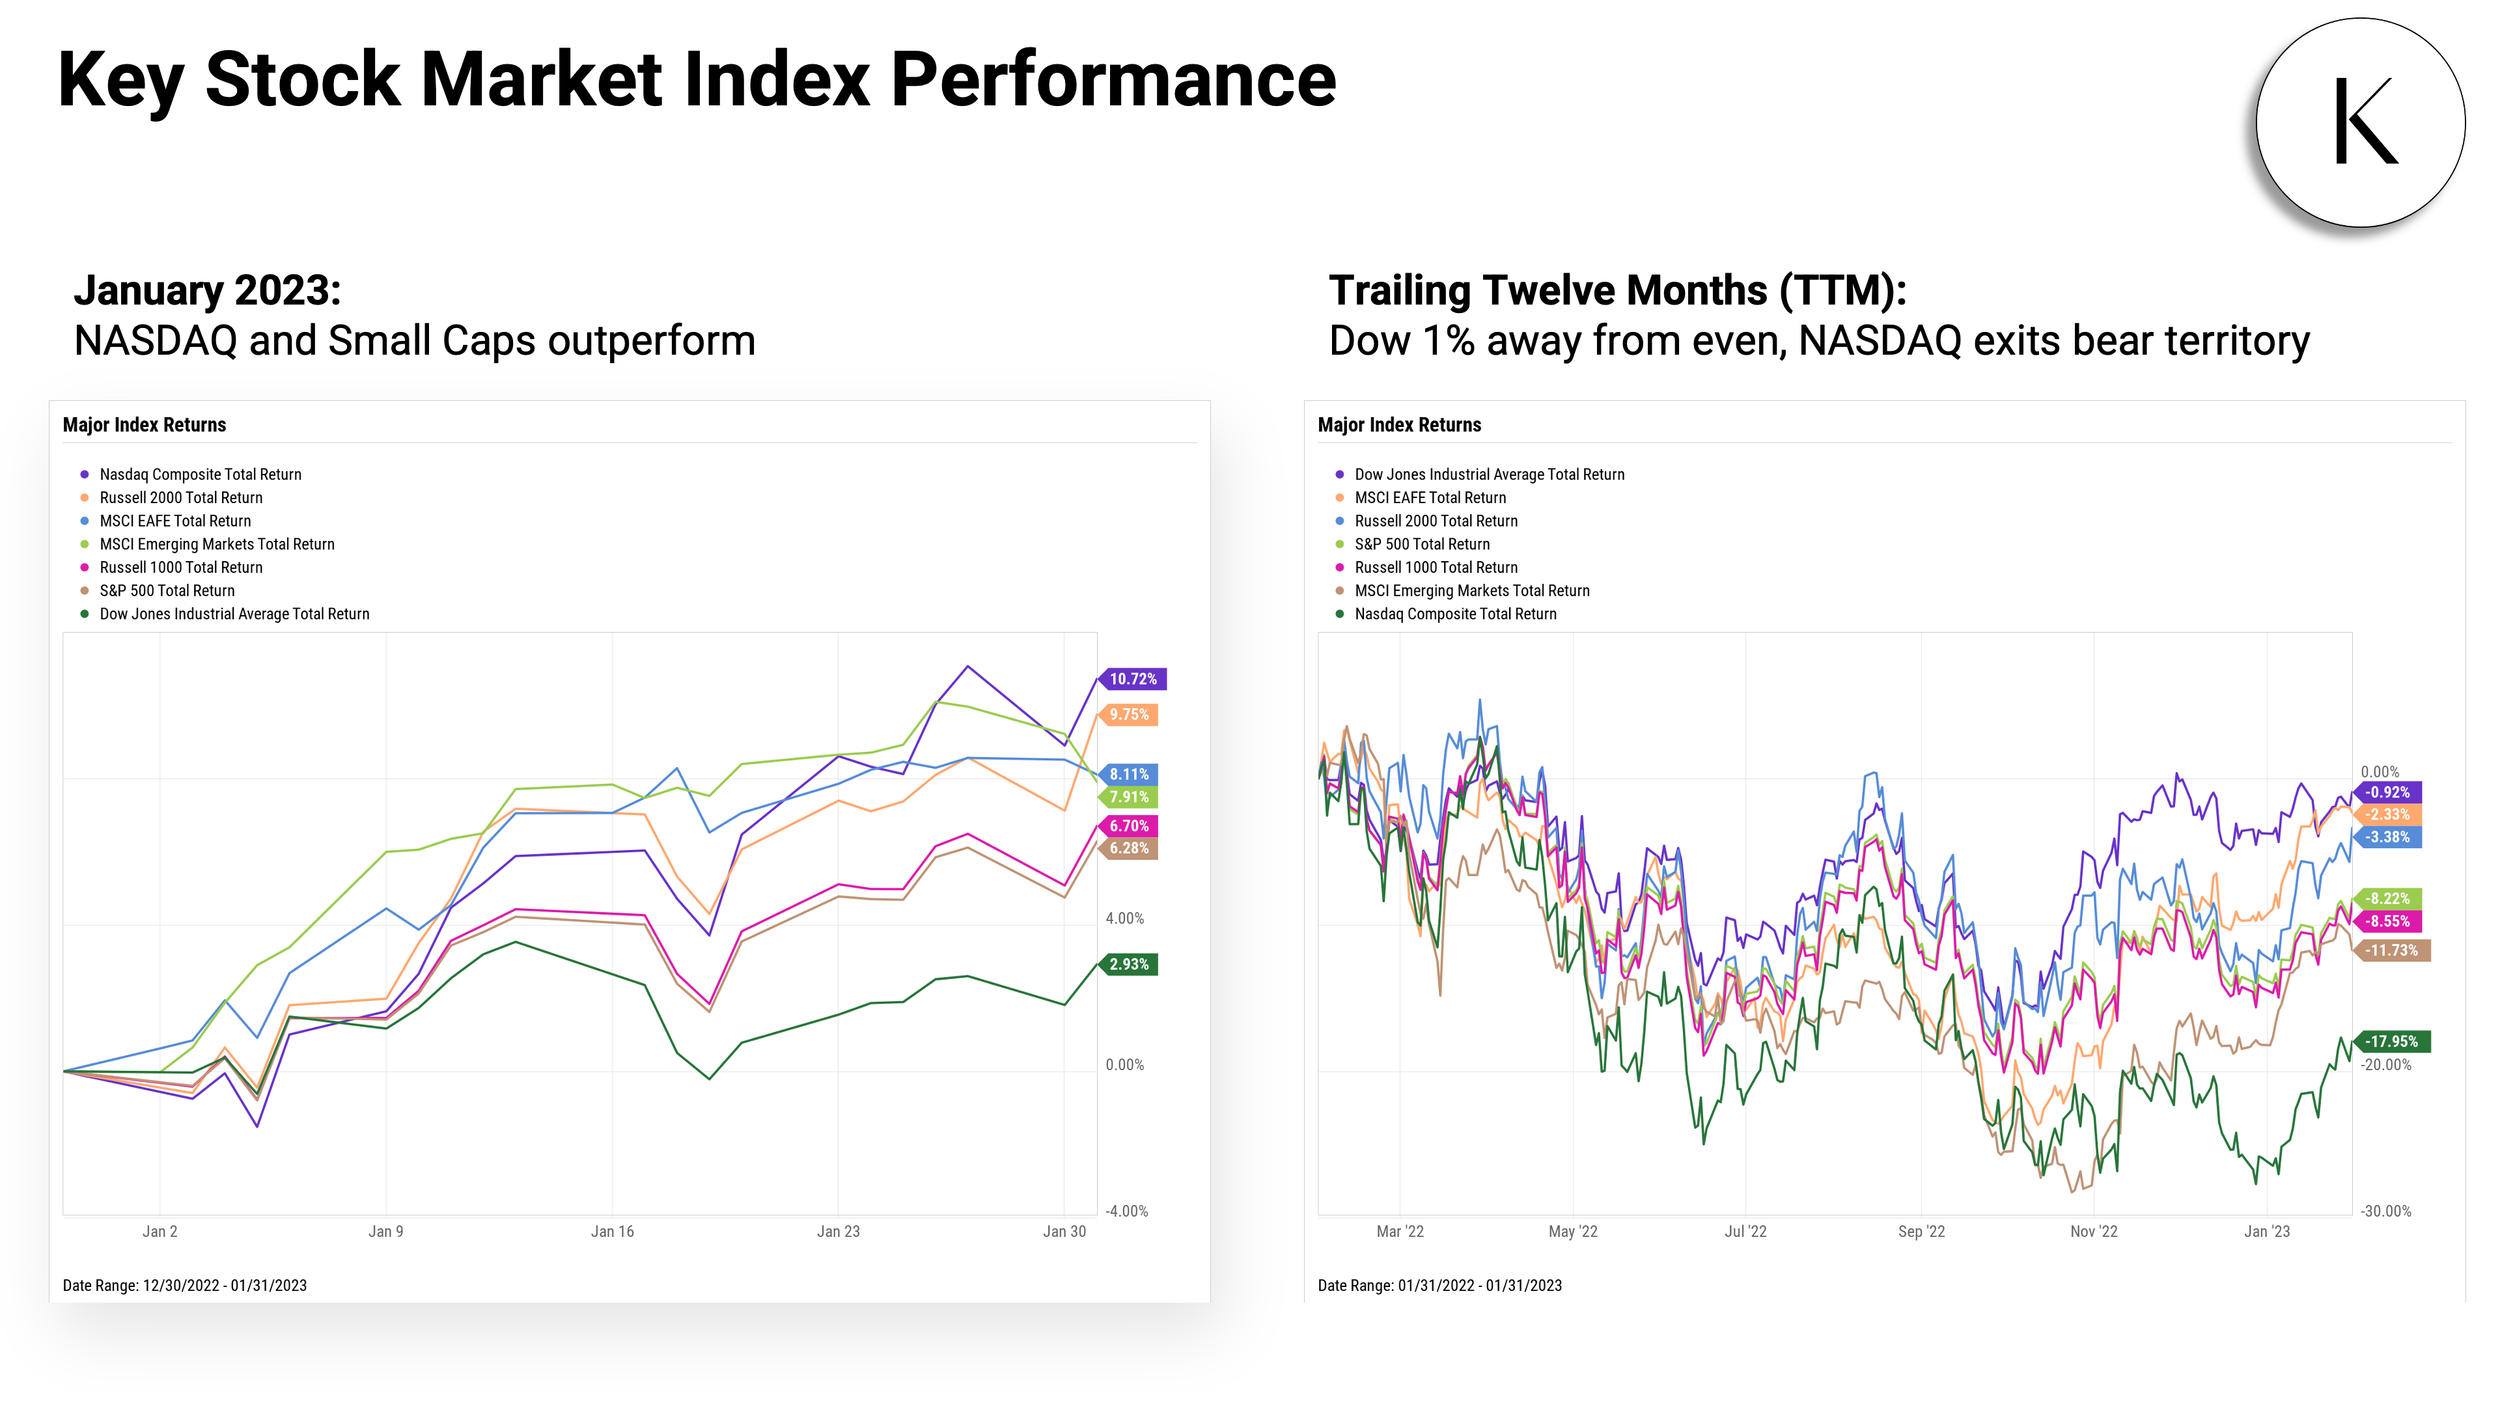
January Returns: S&P 500: 6.3%, Nasdaq: 10.7%, Dow Jones: 2.9%, Russell 2000: 9.8%, Russell 1000: 6.7%, Developed Markets: +8.1%, Emerging Markets: 7.9%.

January Performance:
Small-Cap Growth 1-Month: 10.0%
Small-Cap Value 1-Month: 9.7%
Large-Cap Growth 1-Month: 8.3%
Large-Cap Value 1-Month: 5.1%
TTM:
Large-Cap Value TTM: -0.6%
Small-Cap Value TTM: -0.7%
Small-Cap Growth TTM: -6.3%
Large-Cap Growth TTM: -16.1%

January Returns: Consumer Discretionary: 15.1%, Communication Services: 14.8%, Real Estate: 9.9%, Technology: 9.3%, Materials: 9.0%, Financials: 6.9%, Industrials: 3.7%, Energy: 2.8%.

January Returns:
Warner Bros.Discovery (WBD): 56.3%, Tesla (TSLA): 40.6%, Western Digital (WDC): 39.3%, Paramount Global (PARA): 37.2%, Carnival Corp (CCL): 34.2%, NVIDIA (NVDA): 33.7%, SVB Financial Group (SIVB): 31.4%, Royal Caribbean Group (RCL): 31.4%, Expedia Group (EXPE): 30.5%, MarketAxess Holdings (MKTX): 30.5%.

January Returns:
Northrop Grumman (NOC): -17.9%, Enphase Energy (ENPH): -16.4%, Pfizer (PFE): -13.8%, Archer-Daniels Midland (ADM): -10.8%, NextEra Energy (NEE): -10.7%, Baxter International (BAX): -10.4%, McCormick & Co (MKC): -9.4%, AbbVie (ABBV): -8.6%, Campbell Soup Co (CPB): -8.5%, Johnson & Johnson (JNJ): -7.5%.
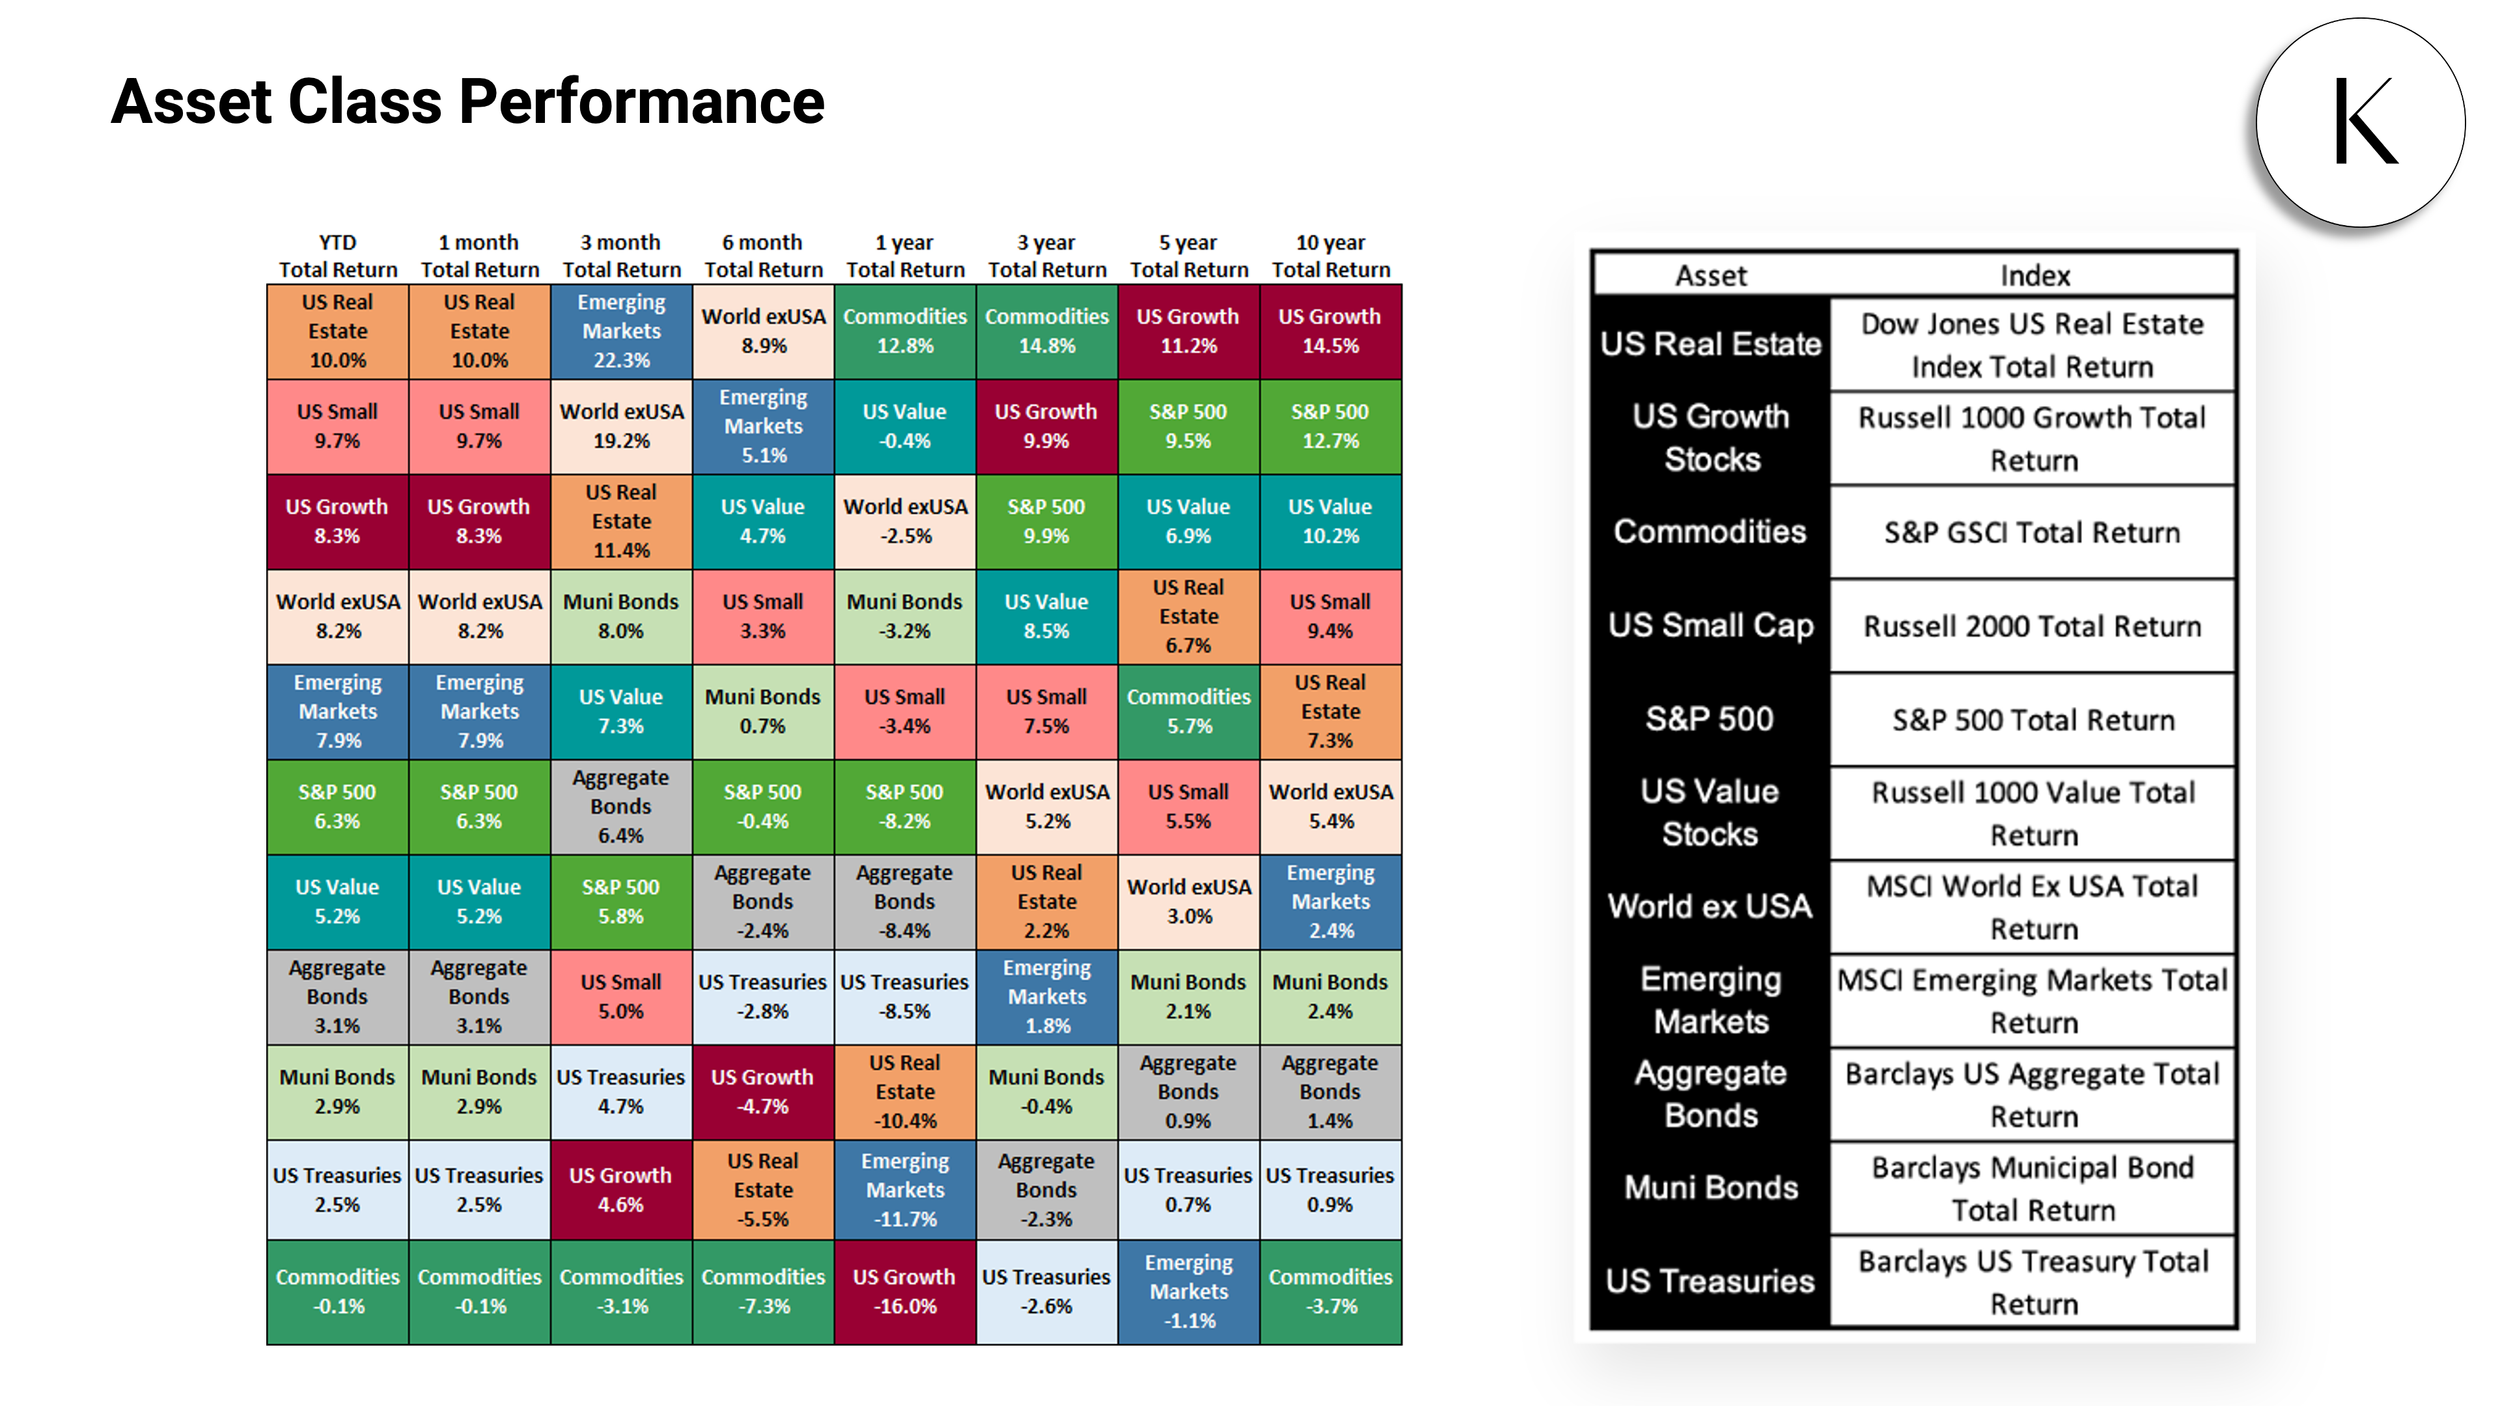
Real Estate’s 10.0% gain made it the best-performing asset class in January, followed by US Small Caps in a close second at 9.7%. The only asset class to finish January in the red was Commodities, which was also negative throughout the second half of 2022 but up 12.8% over the past twelve months.

Inflation slowed for the sixth straight month to 6.45% YoY, and core inflation fell a quarter of a percentage point as well. The gap between new and existing home sales widened—US New Single-Family Home Sales MoM grew for the third straight month, but Existing Home Sales contracted 1.5%, marking its 11th consecutive monthly fall. The median national existing home price also declined 1.5%. In the world of crypto, Bitcoin and Ethereum each soared well over 30% last month, marking quite a turnaround from last year when both cryptocurrencies plummeted around 65%.

Employment numbers are still showing overall improvement with Unemployment down to 3.5% and Labor Force Participation Rate increased to 62.3%.

US Inflation cooled down for the sixth straight month, falling 0.66 percentage points to 6.45%. YoY US Core Inflation dipped a quarter of a percentage point to 5.71%. The Federal Reserve raised the Upper Limit Target Federal Funds Rate by 25 points to 4.75% at its February 1st meeting, the first rate hike of just 25 bps since March 2022.

The US ISM Manufacturing PMI fell deeper into contraction territory in January. At 47.4, January’s reading marks the eighth consecutive monthly decline for the indicator, and also its lowest reading since May 2020.

MoM US New Single-Family Home Sales increased 2.3% in December, three months removed from a plummet of nearly 15%.
Existing housing data wasn’t as cheerful, however—MoM US Existing Home Sales declined 1.5% in December, marking the 11th consecutive negative month for existing home sales. Slower sales once again translated into lower home prices; the Median Sales Price of Existing Homes also declined by 1.5% to $366,900, falling for a sixth straight month.

Bitcoin and Ethereum each tumbled around 65% last year. However, Bitcoin surged 37.2% in January and Ethereum jumped 30.6%. Is this a signal that the worst is over for crypto, or just another hill on the crypto-coaster?

Yields on longer-term treasuries fell while those with short-term maturities rose. The 5-Year, 10-Year, and 20-Year rates all declined by 36 basis points. On the flip side, yields on the 1-Month, 3-Month, and 6-Month Treasury Bills increased in January. The 1-Month saw the largest increase across the yield curve, at 46 basis points. Globally, Japan’s 10 Year Government Bond Interest Rate increased by six basis points.

Yields on longer-term treasuries fell while those with shorter-term maturities rose. The 5-Year, 10-Year, and 20-Year all declined by 36 basis points.
On the flip side, yields on the 1-Month, 3-Month, and 6-Month Treasury Bills increased in January. The 1-Month saw the largest increase across the yield curve, at 46 basis points.

Japan’s 10 Year Government Bond Interest Rate was the only long-term fixed income instrument to log an increase on this chart (6 bps).

Corporate bond yields declined across the board in January, with lower-grade BBB logging the largest decrease at 41 basis points.

Thank you for reading the January 2023 issue of "The Wall Street Report".
Subscribe to this monthly report: https://www.konstandinovic.com/newsletter